
Oregon State Beavers en California Golden Bears

11-10, 1-7 Pac-12
68
11-10, 1-7 Pac-12
F
| 1 | 2 | T | |
|---|---|---|---|
ORST | 41 | 27 | 68 |
CAL | 33 | 38 | 71 |

12-8, 4-4 Pac-12
71
12-8, 4-4 Pac-12

Oregon State Beavers
titulares |
suplentes |
equipo |
Min | PTS | FG | 3PT | TL A-I | REB | AST | Pér | STL | BLK | OREB | DREB | PF |
| 32 | 10 | 5-13 | 0-0 | 0-0 | 6 | 0 | 0 | 0 | 1 | 3 | 3 | 0 |
| 34 | 14 | 7-15 | 0-0 | 0-0 | 8 | 8 | 2 | 2 | 0 | 3 | 5 | 1 |
| 6 | 0 | 0-0 | 0-0 | 0-0 | 0 | 1 | 0 | 0 | 0 | 0 | 0 | 0 |
| 33 | 12 | 4-9 | 1-3 | 3-4 | 0 | 3 | 1 | 1 | 0 | 0 | 0 | 0 |
| 34 | 25 | 10-16 | 2-3 | 3-3 | 5 | 2 | 0 | 2 | 0 | 4 | 1 | 1 |
Min | PTS | FG | 3PT | TL A-I | REB | AST | Pér | STL | BLK | OREB | DREB | PF |
| 6 | 0 | 0-0 | 0-0 | 0-0 | 1 | 0 | 0 | 0 | 1 | 0 | 1 | 0 |
| 33 | 4 | 1-4 | 0-0 | 2-8 | 9 | 2 | 5 | 0 | 1 | 4 | 5 | 3 |
| 16 | 0 | 0-2 | 0-0 | 0-0 | 1 | 0 | 1 | 0 | 0 | 0 | 1 | 1 |
| 6 | 3 | 1-1 | 1-1 | 0-0 | 1 | 0 | 1 | 0 | 0 | 0 | 1 | 0 |
68 | 28-60 | 4-7 | 8-15 | 36 | 16 | 10 | 5 | 3 | 17 | 19 | 6 | |
47% | 57% | 53% |
California Golden Bears
titulares |
suplentes |
equipo |
Min | PTS | FG | 3PT | TL A-I | REB | AST | Pér | STL | BLK | OREB | DREB | PF |
| 28 | 12 | 6-8 | 0-0 | 0-0 | 5 | 3 | 3 | 0 | 1 | 2 | 3 | 4 |
| 28 | 12 | 6-9 | 0-0 | 0-0 | 7 | 2 | 0 | 0 | 0 | 2 | 5 | 3 |
| 14 | 2 | 1-3 | 0-2 | 0-0 | 0 | 5 | 0 | 0 | 0 | 0 | 0 | 3 |
| 39 | 15 | 5-16 | 3-11 | 2-2 | 8 | 2 | 1 | 1 | 1 | 4 | 4 | 2 |
| 39 | 14 | 5-14 | 4-9 | 0-0 | 1 | 7 | 3 | 1 | 0 | 0 | 1 | 1 |
Min | PTS | FG | 3PT | TL A-I | REB | AST | Pér | STL | BLK | OREB | DREB | PF |
| 20 | 8 | 4-4 | 0-0 | 0-0 | 6 | 3 | 2 | 0 | 2 | 3 | 3 | 0 |
| 4 | 2 | 1-2 | 0-0 | 0-0 | 0 | 0 | 0 | 1 | 0 | 0 | 0 | 0 |
| 5 | 0 | 0-1 | 0-1 | 0-0 | 0 | 1 | 0 | 0 | 0 | 0 | 0 | 0 |
| 23 | 6 | 2-4 | 2-3 | 0-0 | 1 | 2 | 0 | 0 | 0 | 0 | 1 | 3 |
71 | 30-61 | 9-26 | 2-2 | 29 | 25 | 9 | 3 | 4 | 11 | 18 | 16 | |
49% | 35% | 100% |
Información del partido
Berkeley, CA
ESPNU
Árbitro:Chris Rastatter
Árbitro:Kevin Brill
Árbitro:D.G. Nelson
2025-26 Posiciones
División I de la NCAA
| West Coast Conference | CONF | JD | GEN |
|---|---|---|---|
| Gonzaga | 16-2 | - | 28-3 |
| Saint Mary's | 16-2 | - | 27-4 |
| Santa Clara | 15-3 | 1 | 24-7 |
| Oregon State | 9-9 | 7 | 16-15 |
| Seattle U | 8-10 | 8 | 19-12 |
| Pacific | 8-10 | 8 | 17-14 |
| San Francisco | 8-10 | 8 | 16-15 |
| Washington State | 7-11 | 9 | 12-19 |
| Loyola Marymount | 6-12 | 10 | 15-16 |
| Portland | 6-12 | 10 | 13-18 |
| San Diego | 5-13 | 11 | 11-20 |
| Pepperdine | 4-14 | 12 | 9-22 |
| Atlantic Coast Conference | CONF | JD | GEN |
|---|---|---|---|
| Duke | 16-1 | - | 28-2 |
| Virginia | 14-3 | 2 | 26-4 |
| Miami | 12-4 | 3.5 | 23-6 |
| North Carolina | 12-5 | 4 | 24-6 |
| Clemson | 11-6 | 5 | 21-9 |
| Louisville | 10-7 | 6 | 21-9 |
| NC State | 10-7 | 6 | 19-11 |
| California | 8-8 | 7.5 | 20-9 |
| SMU | 8-8 | 7.5 | 19-10 |
| Florida State | 8-8 | 7.5 | 15-14 |
| Virginia Tech | 8-9 | 8 | 19-11 |
| Stanford | 7-9 | 8.5 | 18-11 |
| Wake Forest | 6-11 | 10 | 15-15 |
| Syracuse | 6-11 | 10 | 15-15 |
| Notre Dame | 4-12 | 11.5 | 13-16 |
| Pittsburgh | 4-12 | 11.5 | 11-18 |
| Boston College | 3-14 | 13 | 10-20 |
| Georgia Tech | 2-14 | 13.5 | 11-18 |
Noticias de baloncesto universitario masculino
¿El All-Star game ha perdido su importancia?
Stephen A. Smith comparte sus pensamientos sobre el Juego de Estrellas luego de los comentarios de Kevin Durant criticando la falta de esfuerzo de los jugadores internacionales.
20d

Jugadores universitarios entre acusados en esquema de amaño
Varios exjugadores de baloncesto NCAA fueron acusados en un esquema de manipulación que involucró la alteración de 29 juegos, según una acusación federal.
2M
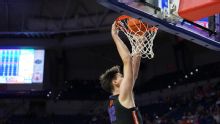
Olivier Rioux, de 2.36 metros de altura, anota su primera canasta
El pívot de los Gators de 7-9 pies, el adolescente más alto del mundo, clava el balón para su primera canasta en el baloncesto NCAA.
2M