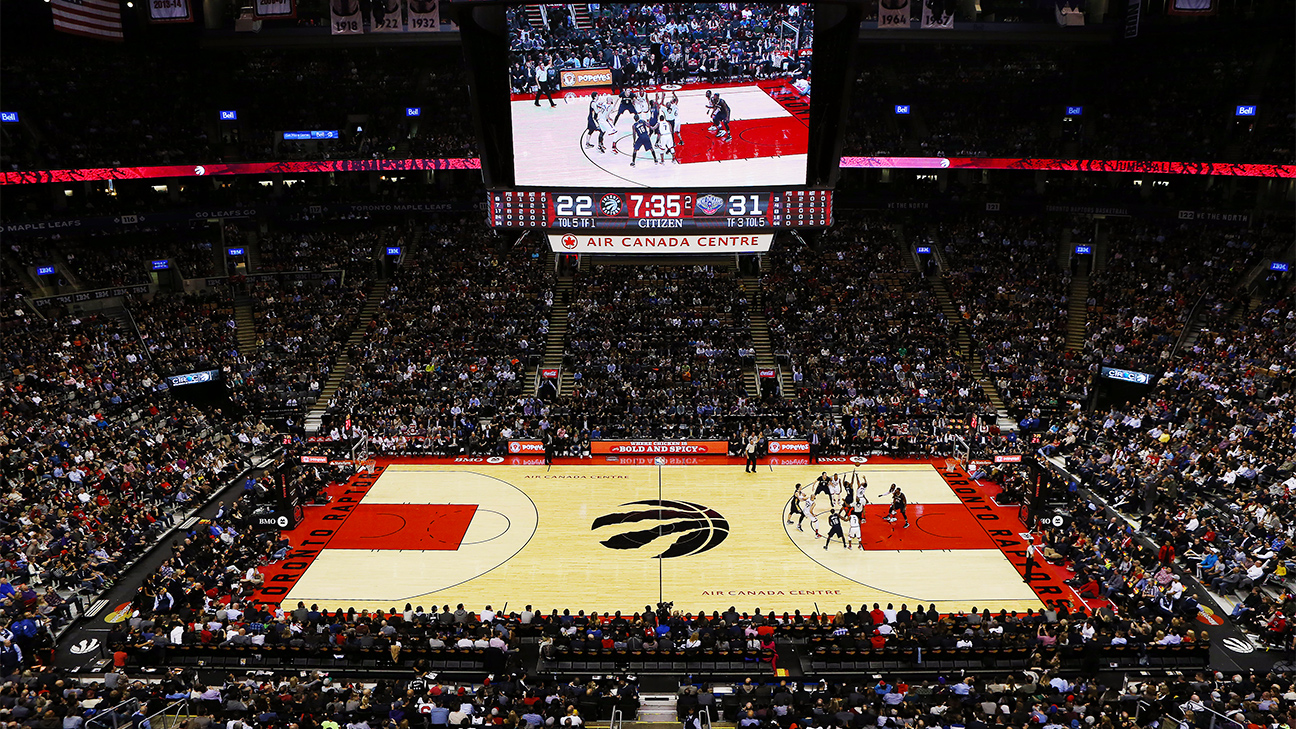
Portland Trail Blazers en Toronto Raptors
Líderes del Juego
Estadísticas de Equipo
54% (38-70)
FG%
51% (37-72)
41% (7-17)
3PT%
56% (5-9)
76% (19-25)
FT%
71% (17-24)
32
Entregas
32
38
Rebotes
42
15
Ventaja más amplia
7
Información del partido
Toronto, ON

TSNT
Árbitro:Ron Garretson
Árbitro:Leroy Richardson
Árbitro:Eric Dalen

Estadísticas de Equipo
| FG | 38-70 | 37-72 |
| FG% | 54 | 51 |
| 3PT | 7-17 | 5-9 |
| 3PT% | 41 | 56 |
| TL A-I | 19-25 | 17-24 |
| FT% | 76 | 71 |
| Rebotes | 38 | 42 |
| Rebotes ofensivos | 9 | 12 |
| Rebotes defensivos | 23 | 23 |
| Asistencias | 23 | 21 |
| Robos | 10 | 8 |
| Bloqueos | 8 | 2 |
| Entregas | 32 | 32 |
| Puntos a raíz de un balón perdido | 12 | 20 |
| Puntos de contraataque | 14 | 15 |
| Puntos en la pintura | 44 | 48 |
| Faltas individuales | 15 | 20 |
| Faltas técnicas | 1 | 0 |
| Falta intencional | 0 | 0 |
| Ventaja más amplia | 15 | 7 |
Partidos
2025-26 Posiciones
Conferencia del Oeste
| Noroeste | G | P | PCT | JD | R |
|---|---|---|---|---|---|
| Oklahoma City | 42 | 14 | .750 | - | P1 |
| Denver | 35 | 21 | .625 | 7 | P1 |
| Minnesota | 34 | 22 | .607 | 8 | G2 |
| Portland | 27 | 29 | .482 | 15 | G1 |
| Utah | 18 | 38 | .321 | 24 | P1 |
Conferencia del Este
| Atlántico | G | P | PCT | JD | R |
|---|---|---|---|---|---|
| Boston | 36 | 19 | .655 | - | G2 |
| New York | 35 | 21 | .625 | 1.5 | P1 |
| Toronto | 33 | 23 | .589 | 3.5 | G1 |
| Philadelphia | 30 | 25 | .545 | 6 | P3 |
| Brooklyn | 15 | 39 | .278 | 20.5 | P2 |
Noticias - NBA

Washington se quedó con el duelo de necesitados ante Indiana: 112-105
Anthony Gill se destacó con 13 puntos y 8 rebotes en los Wizards. Jarace Walker aportó 21 unidades en los Pacers.
2h

Paolo Banchero brilló en la paliza del Magic sobre los Kings
30 puntos, 5 rebotes y 6 asistencias para el alero en la victoria de Orlando por 131 a 94 sobre Sacramento.
2h

Celtics, Pistons, Spurs y Rockets marcaron el paso en el regreso de la NBA
Jaylen Brown, Cade Cunningham y Kevin Durant, algunos de los héroes de la jornada en el regreso a la acción, tras la pausa por el All-Star Game.
1h
GAMBLING PROBLEM? CALL 1-800-GAMBLER, (800) 327-5050 or visit gamblinghelplinema.org (MA). Call 877-8-HOPENY/text HOPENY (467369) (NY). Please Gamble Responsibly. 888-789-7777/visit ccpg.org (CT), or visit www.mdgamblinghelp.org (MD). 21+ and present in most states. (18+ DC/KY/NH/WY). Void in ONT/OR/NH. Eligibility restrictions apply. On behalf of Boot Hill Casino & Resort (KS). Terms: sportsbook.draftkings.com/promos.
Copyright: © 2026 ESPN Enterprises, LLC. All rights reserved.


