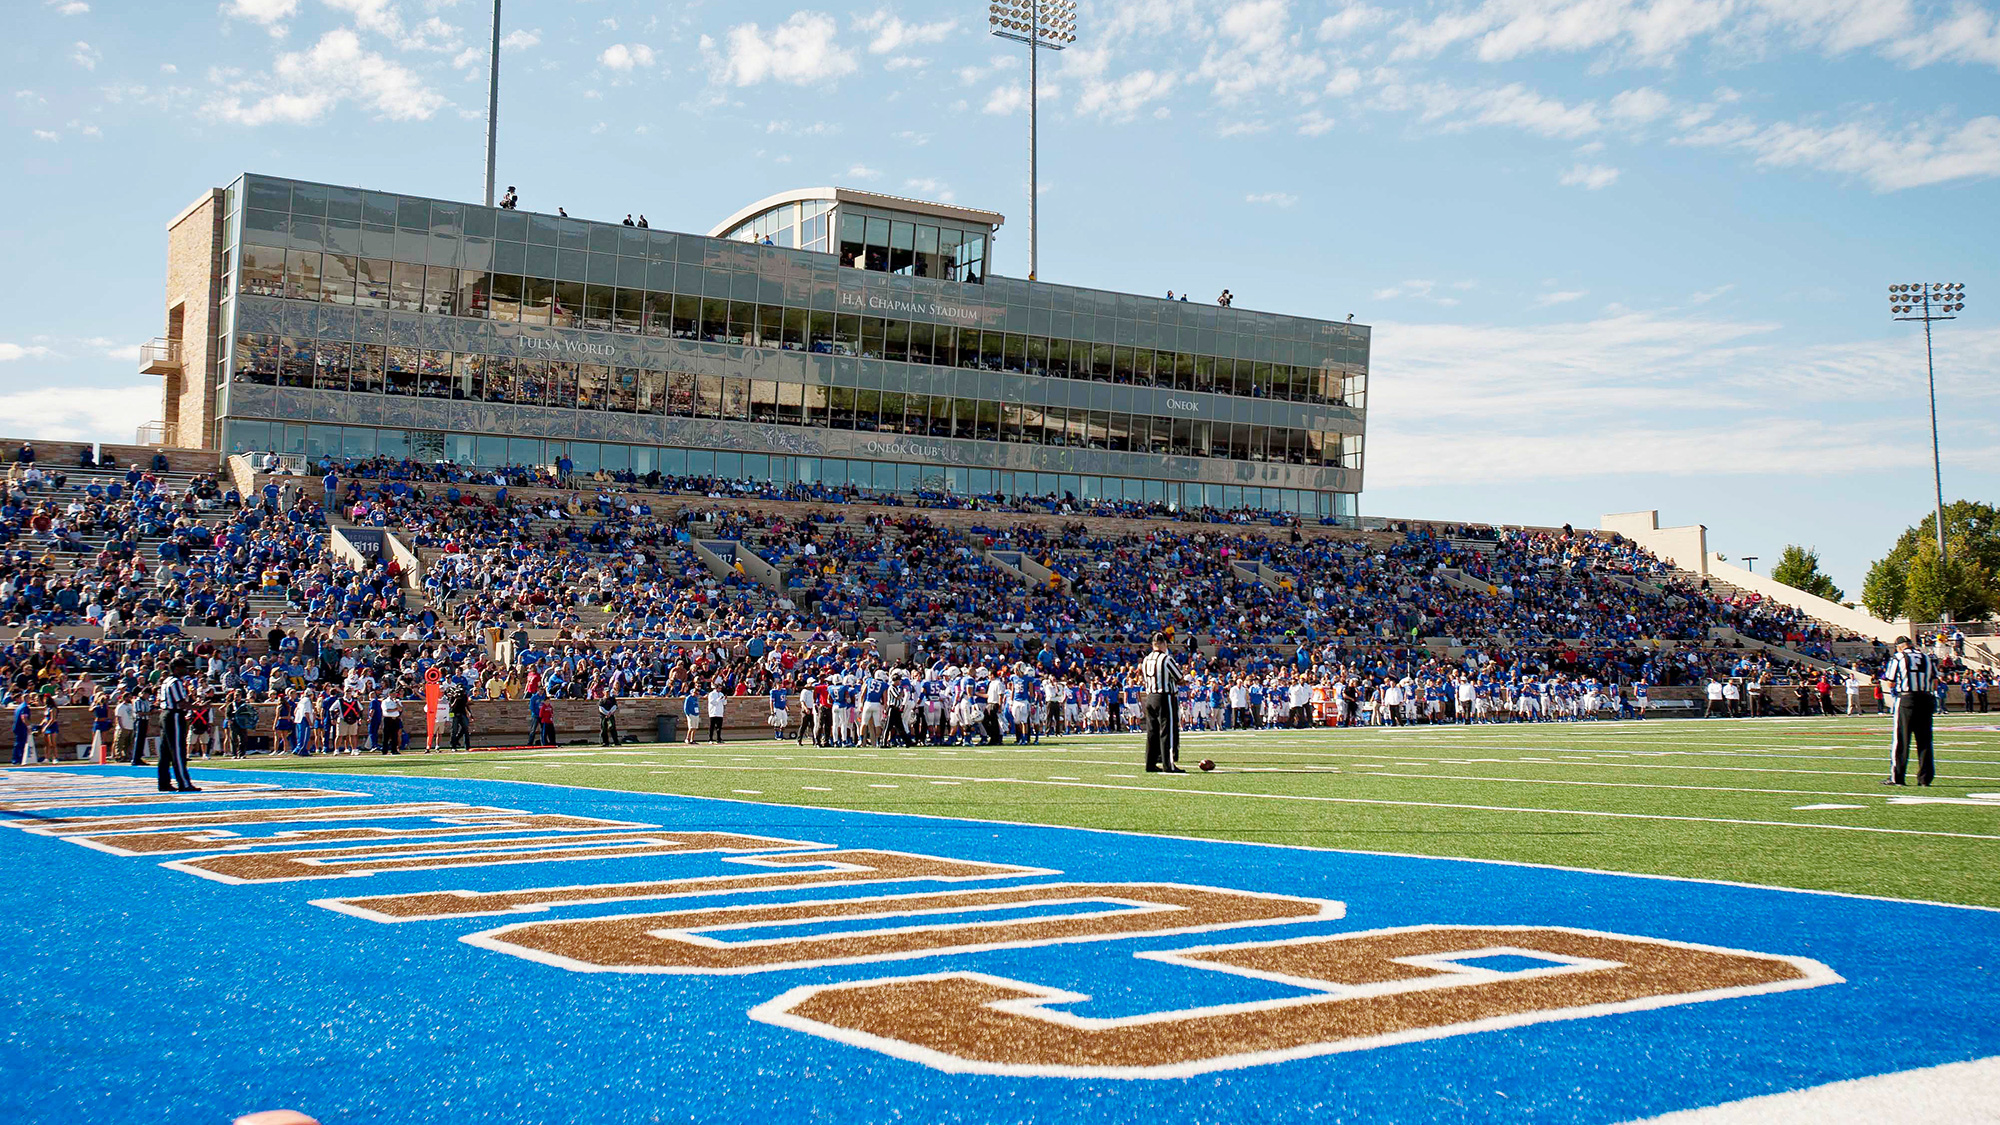
UT San Antonio Roadrunners en Tulsa Golden Hurricane

UT San Antonio RoadrunnersUTSAUTSA
4-5, 3-2 Visitante
34
4-5, 3-2 Visitante
F
| 1 | 2 | 3 | 4 | T | |
|---|---|---|---|---|---|
UTSA UTSA | 14 | 10 | 0 | 10 | 34 |
Tulsa TLSA | 0 | 0 | 8 | 7 | 15 |

Tulsa Golden HurricaneTulsaTLSA
2-6, 1-3 Local
15
2-6, 1-3 Local
Líderes del Juego


114
E. SozaQB
16/20, 1 TD
114

159
D. EvansQB
12/22, 1 TD, 1 INT
159

135
D. Glasco IIRB
21 CAR
135

109
T. WattsRB
15 CAR
109

34
K. JonesWR
4 REC
34

87
K. LucasWR
5 REC
87

1
C. RogersDE
1

1
D. AlexanderDE
1

9
S. KurfehsLB
6 SOLO
9

11
S. JacksonLB
6 SOLO
11
Estadísticas de Equipo

UTSA

TLSA
400
Yardas totales
378
1
Entregas
4
16
1eros Intentos
20
2-20
Penales
3-20
3/12
3ra oportunidad
9/20
0/0
4ta oportunidad
2/3
30:38
Posesión
29:22
Información del partido
Tulsa, OK


Estadísticas de Equipo
| 1as. oportunidades | 16 | 20 |
| Eficiencia en 3er intento | 3-12 | 9-20 |
| Eficiencia en 4o intento | 0-0 | 2-3 |
| Yardas Totales | 400 | 378 |
| Pasando | 114 | 221 |
| Intent-comp | 16/20 | 25/45 |
| Yardas por pase | 5.7 | 4.9 |
| INT | 0 | 2 |
| Yds | 286 | 157 |
| ACA | 39 | 36 |
| PROM | 7.3 | 4.4 |
| Castigos | 2-20 | 3-20 |
| Pér | 1 | 4 |
| PERD | 1 | 2 |
| INT | 0 | 2 |
| Posesión | 30:38 | 29:22 |
2025 Posiciones
FBS
| American ConferenceAmerican Conference | CONF | GEN |
|---|---|---|
| Tulane | 7-1 | 11-3 |
| North Texas | 7-1 | 12-2 |
| Navy | 7-1 | 11-2 |
| East Carolina | 6-2 | 9-4 |
| South Florida | 6-2 | 9-4 |
| Army | 4-4 | 7-6 |
| Memphis | 4-4 | 8-5 |
| UTSA | 4-4 | 7-6 |
| Temple | 3-5 | 5-7 |
| Florida Atlantic | 3-5 | 4-8 |
| Rice | 2-6 | 5-8 |
| UAB | 2-6 | 4-8 |
| Tulsa | 1-7 | 4-8 |
| Charlotte | 0-8 | 1-11 |
Noticias - NCAAF

Drake Maye recibe regalo y envía mensaje a los fans de la NFL en México
El QB de Patriots fue sorprendido con un muñeco de estambre y envió un mensaje a los aficionados en México.
2d

College Football Playoff: Cada MVP del Campeonato Nacional
Fernando Mendoza y Mikail Kamara de Indiana fueron los MVP ofensivo y defensivo del College Football Playoff 2026. Consulta la lista de ganadores.
15d

Fútbol americano colegial: ¿Qué equipo ganó más campeonatos NCAA?
Consulta los programas con más campeonatos nacionales del fútbol americano colegial en la historia.
15d
GAMBLING PROBLEM? CALL 1-800-GAMBLER, (800) 327-5050 or visit gamblinghelplinema.org (MA). Call 877-8-HOPENY/text HOPENY (467369) (NY). Please Gamble Responsibly. 888-789-7777/visit ccpg.org (CT), or visit www.mdgamblinghelp.org (MD). 21+ and present in most states. (18+ DC/KY/NH/WY). Void in ONT/OR/NH. Eligibility restrictions apply. On behalf of Boot Hill Casino & Resort (KS). Terms: sportsbook.draftkings.com/promos.
Copyright: © 2026 ESPN Enterprises, Inc. All rights reserved.