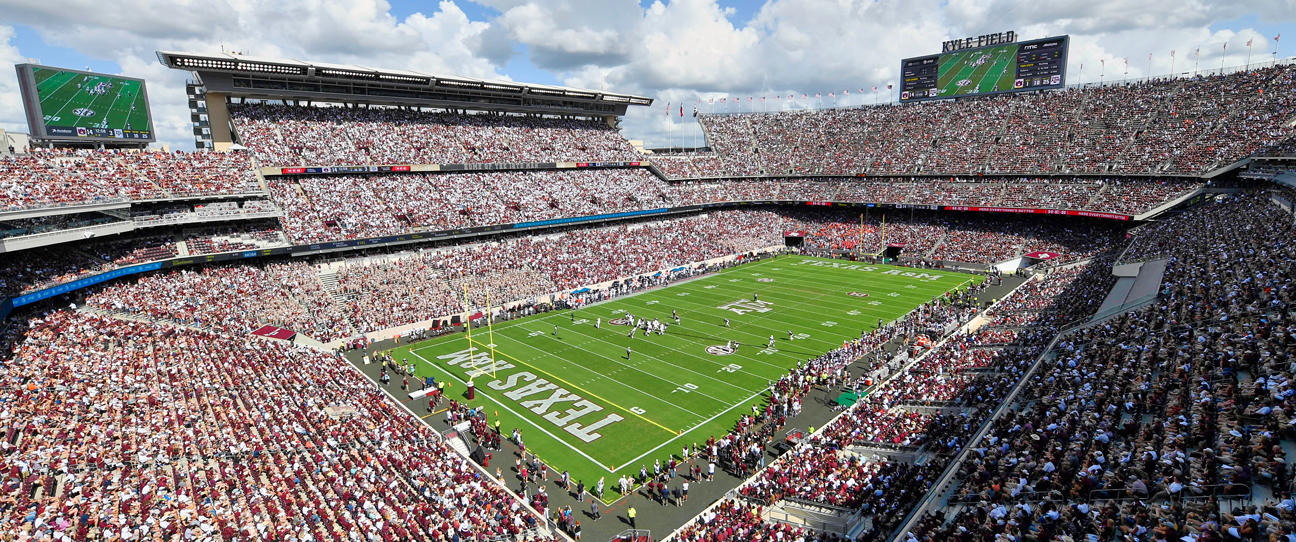
UCLA Bruins en Texas A&M Aggies

16
UCLA BruinsUCLAUCLA
0-1, 0-1 Visitante
24
0-1, 0-1 Visitante
Final/TE
| 1 | 2 | 3 | 4 | OT | T | |
|---|---|---|---|---|---|---|
UCLA UCLA | 3 | 6 | 0 | 15 | 0 | 24 |
Texas A&M TA&M | 0 | 10 | 14 | 0 | 7 | 31 |

Texas A&M AggiesTexas A&MTA&M
1-0, 1-0 Local
31
1-0, 1-0 Local
Líderes del Juego


343
J. RosenQB
26/46, 1 TD, 3 INT
343

239
T. KnightS
22/42, 1 TD, 1 INT
239

91
S. JamaboRB
23 CAR
91

94
T. WilliamsRB
15 CAR
94

115
K. WalkerWR
6 REC, 1 TD
115

78
J. ReynoldsWR
4 REC, 1 TD
78

--
--

1
S. WashingtonLB
1

8
T. GoodmanDB
5 SOLO
8

11
N. HarveyDB
8 SOLO
11
Estadísticas de Equipo

UCLA

TA&M
468
Yardas totales
442
3
Entregas
2
28
1eros Intentos
23
4-17
Penales
6-67
5/18
3ra oportunidad
4/15
1/2
4ta oportunidad
1/2
33:18
Posesión
26:42
Información del partido
College Station, TX

CBS

Estadísticas de Equipo
| 1as. oportunidades | 28 | 23 |
| Eficiencia en 3er intento | 5-18 | 4-15 |
| Eficiencia en 4o intento | 1-2 | 1-2 |
| Yardas Totales | 468 | 442 |
| Pasando | 343 | 239 |
| Intent-comp | 26/47 | 22/42 |
| Yardas por pase | 7.3 | 5.7 |
| INT | 3 | 1 |
| Yds | 125 | 203 |
| ACA | 40 | 41 |
| PROM | 3.1 | 5.0 |
| Castigos | 4-17 | 6-67 |
| Pér | 3 | 2 |
| PERD | 0 | 1 |
| INT | 3 | 1 |
| Posesión | 33:18 | 26:42 |
2025 Posiciones
FBS
| Big Ten ConferenceBig Ten Conference | CONF | GEN |
|---|---|---|
| Indiana | 9-0 | 16-0 |
| Ohio State | 9-0 | 12-2 |
| Oregon | 8-1 | 13-2 |
| USC | 7-2 | 9-4 |
| Michigan | 7-2 | 9-4 |
| Iowa | 6-3 | 9-4 |
| Washington | 5-4 | 9-4 |
| Illinois | 5-4 | 9-4 |
| Minnesota | 5-4 | 8-5 |
| Nebraska | 4-5 | 7-6 |
| Northwestern | 4-5 | 7-6 |
| UCLA | 3-6 | 3-9 |
| Penn State | 3-6 | 7-6 |
| Rutgers | 2-7 | 5-7 |
| Wisconsin | 2-7 | 4-8 |
| Michigan State | 1-8 | 4-8 |
| Maryland | 1-8 | 4-8 |
| Purdue | 0-9 | 2-10 |
FBS
| Southeastern ConferenceSoutheastern Conference | CONF | GEN |
|---|---|---|
| Ole Miss | 7-1 | 13-2 |
| Georgia | 7-1 | 12-2 |
| Texas A&M | 7-1 | 11-2 |
| Alabama | 7-1 | 11-4 |
| Texas | 6-2 | 10-3 |
| Oklahoma | 6-2 | 10-3 |
| Vanderbilt | 6-2 | 10-3 |
| Missouri | 4-4 | 8-5 |
| Tennessee | 4-4 | 8-5 |
| LSU | 3-5 | 7-6 |
| Kentucky | 2-6 | 5-7 |
| Florida | 2-6 | 4-8 |
| Auburn | 1-7 | 5-7 |
| Mississippi State | 1-7 | 5-8 |
| South Carolina | 1-7 | 4-8 |
| Arkansas | 0-8 | 2-10 |
Noticias - NCAAF

Stephen A. Smith analiza dónde podría jugar Tyreek Hill
El analista de ESPN está feliz por el receptor abierto luego de haber sido cortado por los Dolphins.
14h

Field Yates: Fernando Mendoza puede transformar a los Raiders
El equipo de "Get Up" analiza si Fernando Mendoza es la elección correcta para los Raiders con la primera selección.
5d

Drake Maye da su favorito para el Mundial
El quarterback de los Patriots ofrece su pronóstico sobre cuál cree que será la próxima selección campeona del mundo.
13d
GAMBLING PROBLEM? CALL 1-800-GAMBLER, (800) 327-5050 or visit gamblinghelplinema.org (MA). Call 877-8-HOPENY/text HOPENY (467369) (NY). Please Gamble Responsibly. 888-789-7777/visit ccpg.org (CT), or visit www.mdgamblinghelp.org (MD). 21+ and present in most states. (18+ DC/KY/NH/WY). Void in ONT/OR/NH. Eligibility restrictions apply. On behalf of Boot Hill Casino & Resort (KS). Terms: sportsbook.draftkings.com/promos.
Copyright: © 2026 ESPN Enterprises, Inc. All rights reserved.