Clemson Tigers vs Ohio State Buckeyes

3
Ohio State BuckeyesOSUOSU
11-2
0
11-2
F
| 1 | 2 | 3 | 4 | T | |
|---|---|---|---|---|---|
OSU OSU | 0 | 0 | 0 | 0 | 0 |
Clemson CLEM | 10 | 7 | 7 | 7 | 31 |

2
Clemson TigersClemsonCLEM
13-1
31
13-1
Líderes del Juego


127
J.T. BarrettQB
19/33, 2 INT
127

259
D. WatsonQB
23/36, 1 TD, 2 INT
259

67
C. SamuelWR
6 CAR
67

85
W. GallmanRB
18 CAR, 1 TD
85

43
C. SamuelWR
9 REC
43

96
M. WilliamsWR
6 REC
96

1
R. McMillanLB
1

2
C. WatkinsDT
2

15
R. McMillanLB
12 SOLO
15

8
K. JosephLB
8 SOLO
8
Estadísticas de Equipo

OSU

CLEM
215
Yardas totales
470
3
Entregas
2
9
1eros Intentos
24
8-72
Penales
5-60
3/14
3ra oportunidad
8/17
0/2
4ta oportunidad
0/1
24:09
Posesión
35:51
Información del partido
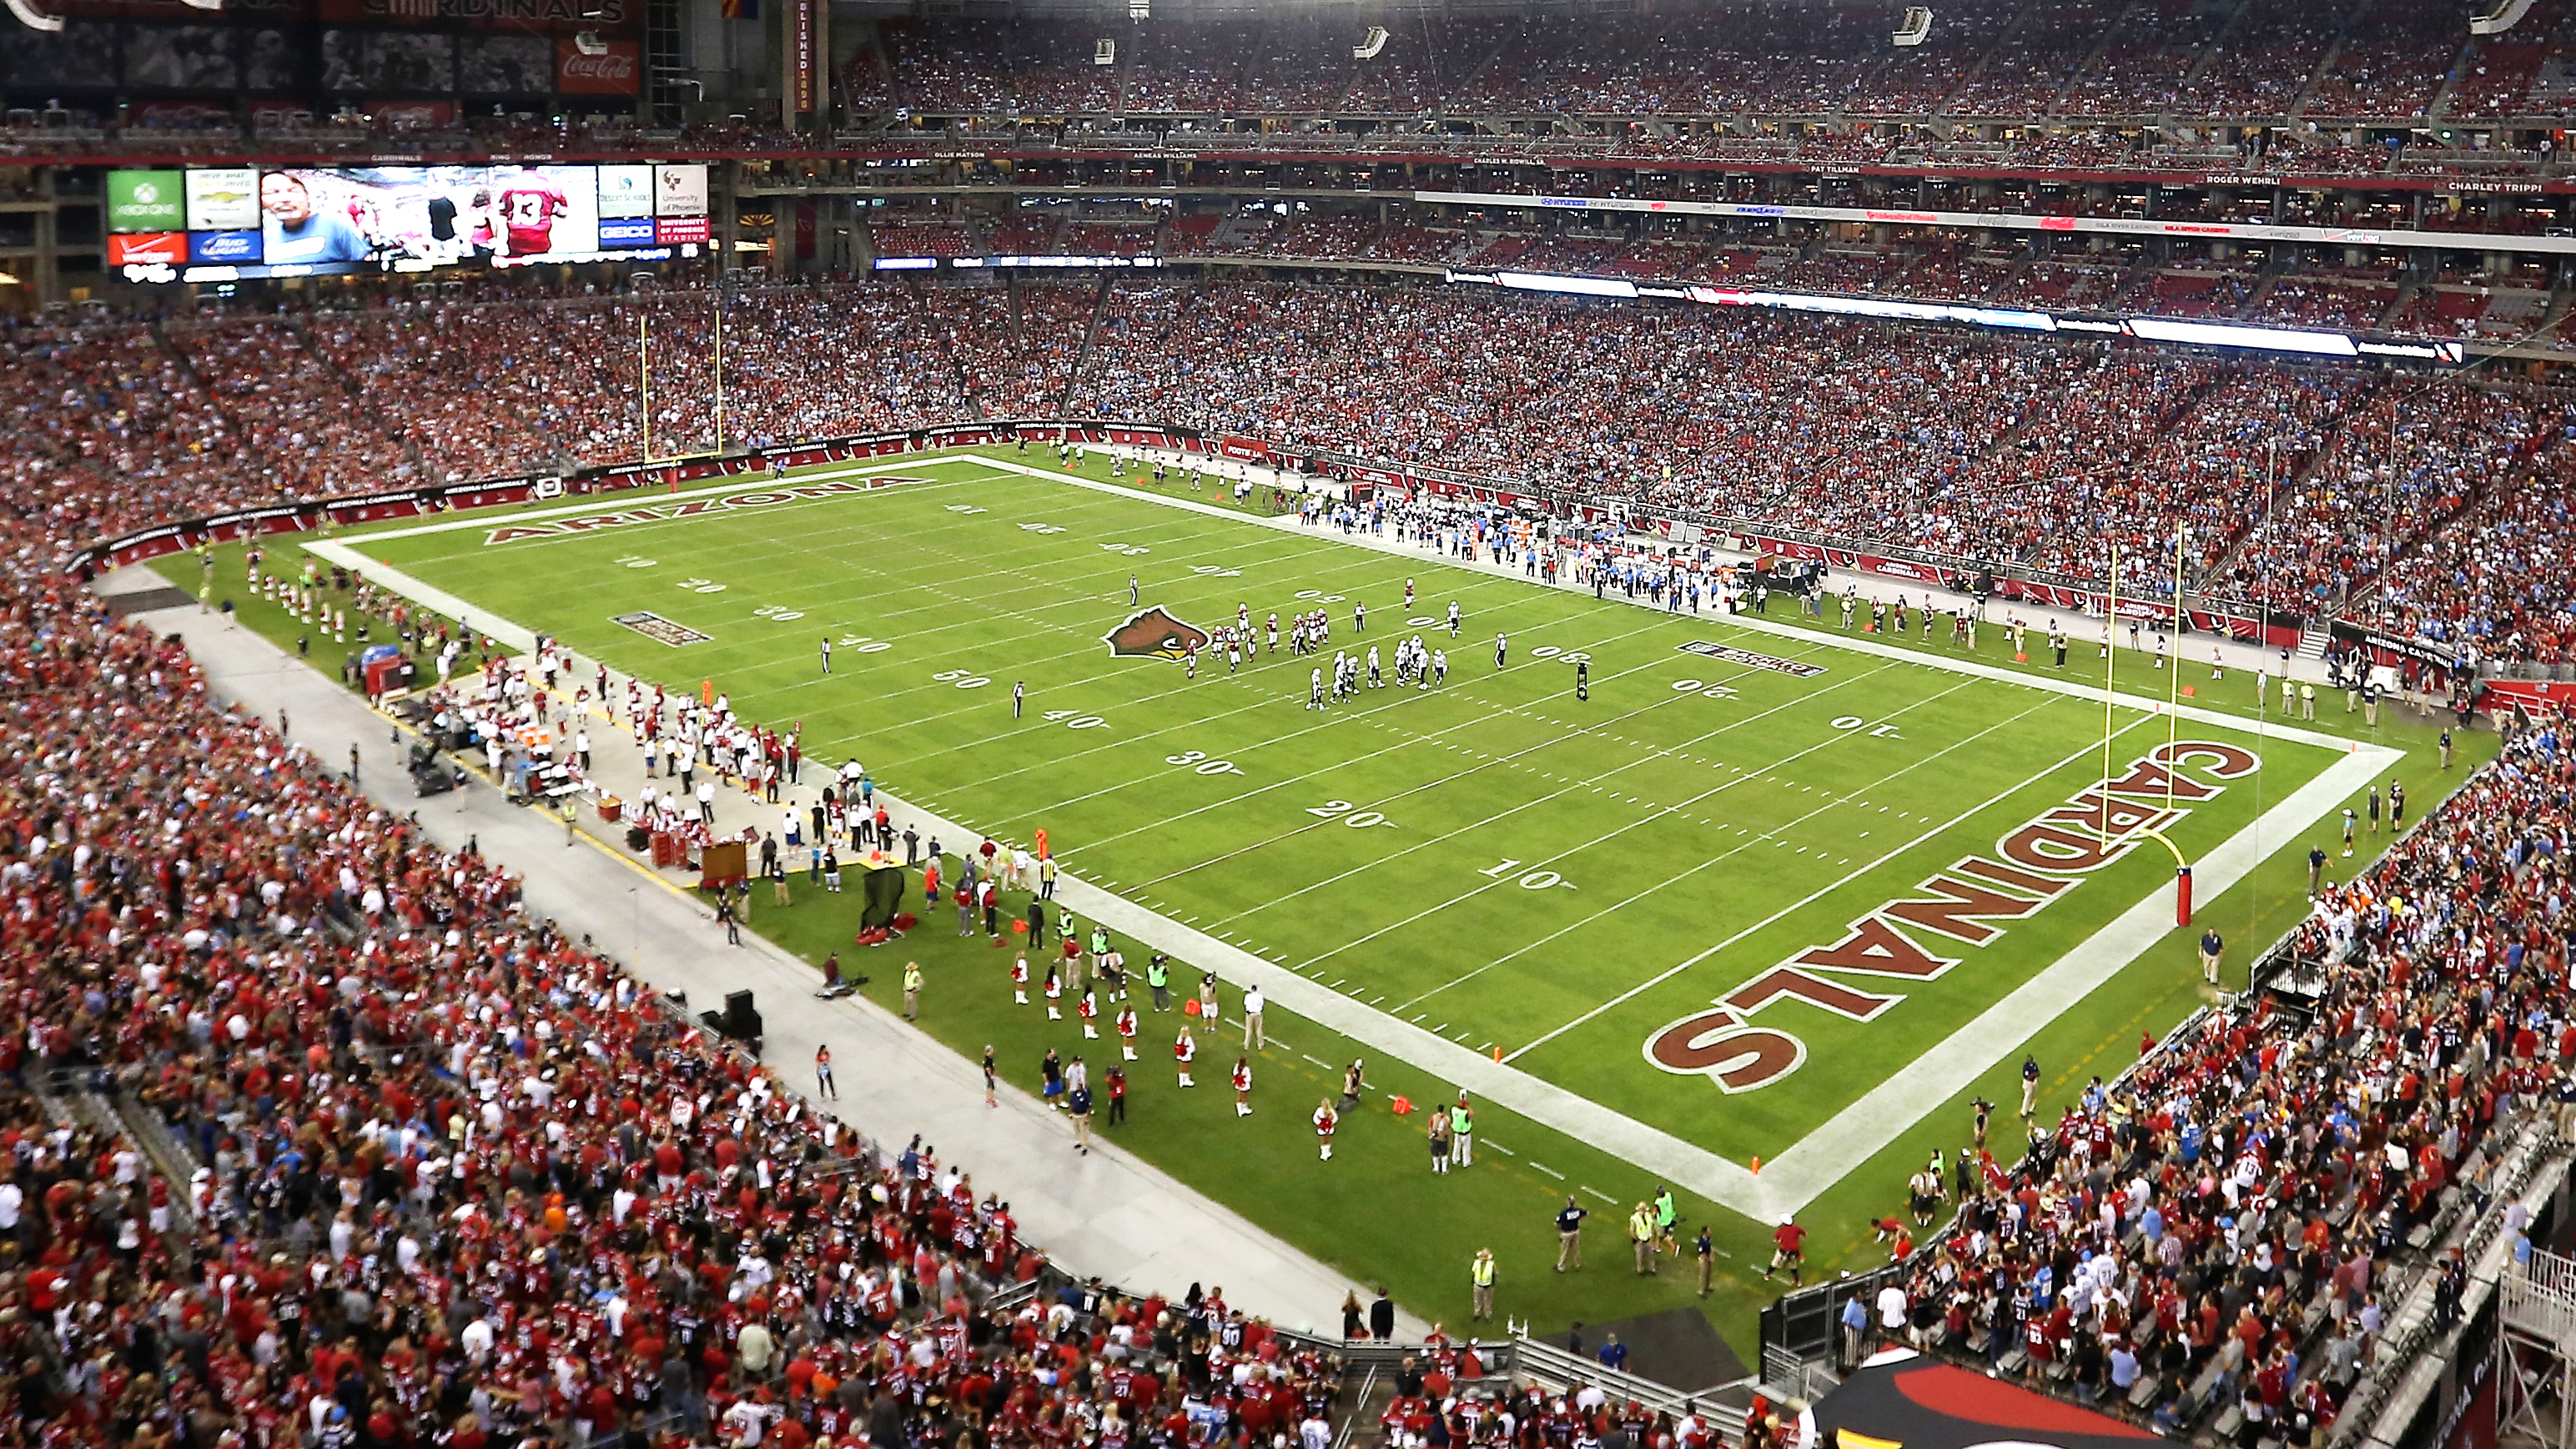
Glendale, AZ

ESPN

Estadísticas de Equipo
| 1as. oportunidades | 9 | 24 |
| Eficiencia en 3er intento | 3-14 | 8-17 |
| Eficiencia en 4o intento | 0-2 | 0-1 |
| Yardas Totales | 215 | 470 |
| Pasando | 127 | 265 |
| Intent-comp | 19/33 | 24/37 |
| Yardas por pase | 3.8 | 7.2 |
| INT | 2 | 2 |
| Yds | 88 | 205 |
| ACA | 23 | 48 |
| PROM | 3.8 | 4.3 |
| Castigos | 8-72 | 5-60 |
| Pér | 3 | 2 |
| PERD | 1 | 0 |
| INT | 2 | 2 |
| Posesión | 24:09 | 35:51 |
Videos de OSU vs CLEM
Gallman takes it to the corner for the Clemson TD
- 0:48
Barrett picked off in the endzone
- 0:30
Tipped pass leads to interception for Clemson
- 0:56
2025 Posiciones
FBS
| Big Ten ConferenceBig Ten Conference | CONF | GEN |
|---|---|---|
| Indiana | 9-0 | 16-0 |
| Ohio State | 9-0 | 12-2 |
| Oregon | 8-1 | 13-2 |
| USC | 7-2 | 9-4 |
| Michigan | 7-2 | 9-4 |
| Iowa | 6-3 | 9-4 |
| Washington | 5-4 | 9-4 |
| Illinois | 5-4 | 9-4 |
| Minnesota | 5-4 | 8-5 |
| Nebraska | 4-5 | 7-6 |
| Northwestern | 4-5 | 7-6 |
| UCLA | 3-6 | 3-9 |
| Penn State | 3-6 | 7-6 |
| Rutgers | 2-7 | 5-7 |
| Wisconsin | 2-7 | 4-8 |
| Michigan State | 1-8 | 4-8 |
| Maryland | 1-8 | 4-8 |
| Purdue | 0-9 | 2-10 |
FBS
| Atlantic Coast ConferenceAtlantic Coast Conference | CONF | GEN |
|---|---|---|
| Virginia | 7-1 | 11-3 |
| SMU | 6-2 | 9-4 |
| Miami | 6-2 | 13-3 |
| Pittsburgh | 6-2 | 8-5 |
| Georgia Tech | 6-2 | 9-4 |
| Duke | 6-2 | 9-5 |
| NC State | 4-4 | 8-5 |
| California | 4-4 | 7-6 |
| Clemson | 4-4 | 7-6 |
| Louisville | 4-4 | 9-4 |
| Wake Forest | 4-4 | 9-4 |
| Stanford | 3-5 | 4-8 |
| Florida State | 2-6 | 5-7 |
| North Carolina | 2-6 | 4-8 |
| Virginia Tech | 2-6 | 3-9 |
| Boston College | 1-7 | 2-10 |
| Syracuse | 1-7 | 3-9 |
Noticias - NCAAF

Drake Maye da su favorito para el Mundial
El quarterback de los Patriots ofrece su pronóstico sobre cuál cree que será la próxima selección campeona del mundo.
3d

Drake Maye recibe regalo y envía mensaje a los fans de la NFL en México
El QB de Patriots fue sorprendido con un muñeco de estambre y envió un mensaje a los aficionados en México.
4d

College Football Playoff: Cada MVP del Campeonato Nacional
Fernando Mendoza y Mikail Kamara de Indiana fueron los MVP ofensivo y defensivo del College Football Playoff 2026. Consulta la lista de ganadores.
18d
GAMBLING PROBLEM? CALL 1-800-GAMBLER, (800) 327-5050 or visit gamblinghelplinema.org (MA). Call 877-8-HOPENY/text HOPENY (467369) (NY). Please Gamble Responsibly. 888-789-7777/visit ccpg.org (CT), or visit www.mdgamblinghelp.org (MD). 21+ and present in most states. (18+ DC/KY/NH/WY). Void in ONT/OR/NH. Eligibility restrictions apply. On behalf of Boot Hill Casino & Resort (KS). Terms: sportsbook.draftkings.com/promos.
Copyright: © 2026 ESPN Enterprises, Inc. All rights reserved.