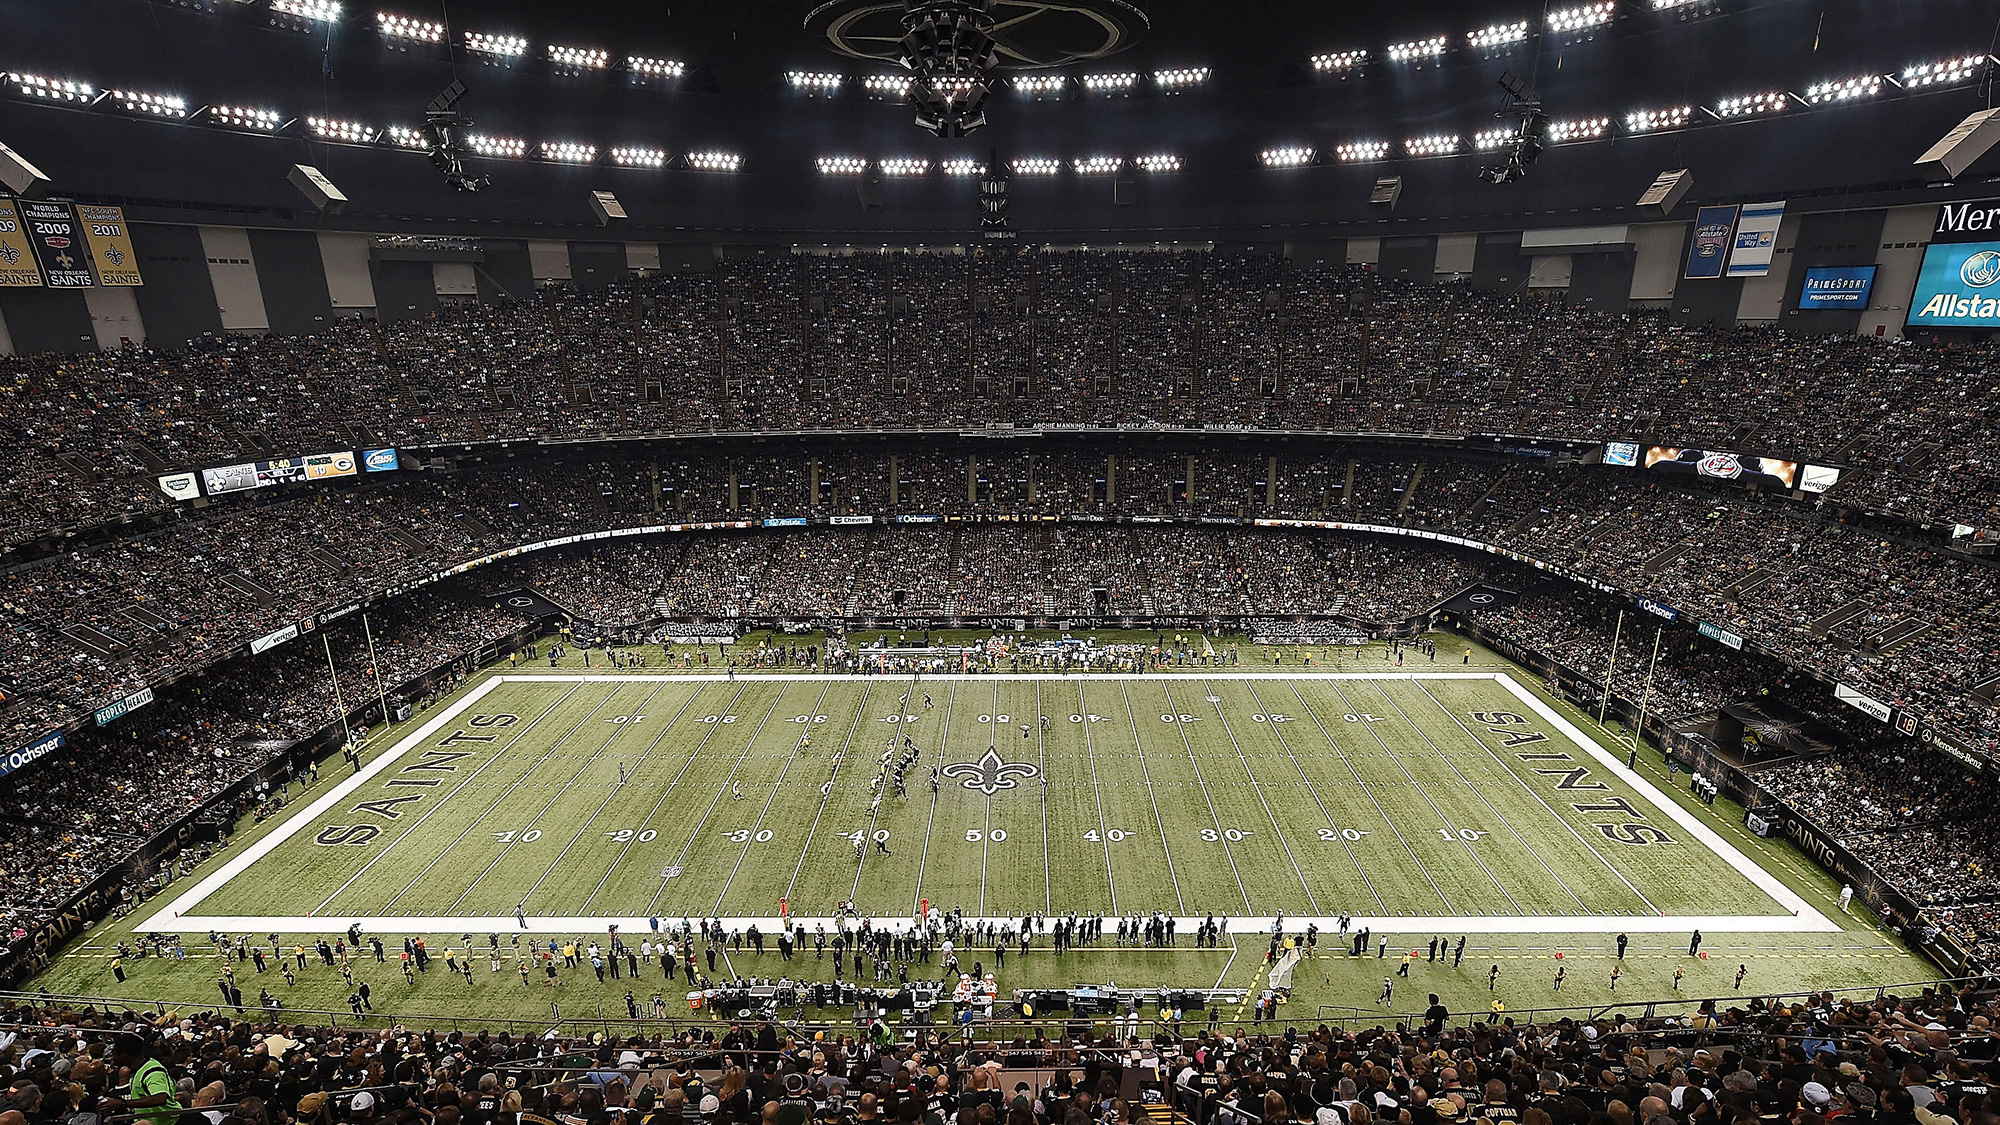
Houston Texans en New Orleans Saints
Líderes del Juego

373
M. SchaubQB
22/39, 3 TD, 1 INT
373

370
D. BreesQB
31/44, 3 TD, 2 INT
370

82
B. TateRB
19 CAR
82

38
M. Ingram IIRB
9 CAR, 1 TD
38

128
A. JohnsonWR
7 REC
128

100
J. GrahamTE
4 REC, 1 TD
100

1
A. SmithDE
1

1
L. TorrenceDB
1

8
G. QuinS
6 SOLO
8

10
J. DunbarLB
6 SOLO
10
Estadísticas de Equipo
473
Yardas totales
454
1
Entregas
2
21
1eros Intentos
27
7-56
Penales
4-26
6/14
3ra oportunidad
8/13
0/1
4ta oportunidad
0/0
1/5
Zona Roja
3/5
30:06
Posesión
29:54
Información del partido
New Orleans, LA

CBS
Réferi:Tony Corrente

Estadísticas de Equipo
| 1as. oportunidades | 21 | 27 |
| 1eros Intentos por pase | 17 | 20 |
| 1eros Intentos por Acarreo | 4 | 5 |
| 1eros Intentos por Penalizaciones | 0 | 2 |
| Eficiencia en 3er intento | 6-14 | 8-13 |
| Eficiencia en 4o intento | 0-1 | 0-0 |
| Jugadas Totales | 66 | 68 |
| Yardas Totales | 473 | 454 |
| Ofensivas totales | 12 | 12 |
| Yardas por jugada | 7.2 | 6.7 |
| Pasando | 364 | 354 |
| Intent-comp | 22/39 | 31/44 |
| Yardas por pase | 8.9 | 7.7 |
| INT | 1 | 2 |
| Capturas - Yardas perdidas | 2-9 | 2-16 |
| Yds | 109 | 100 |
| ACA | 25 | 22 |
| PROM | 4.4 | 4.5 |
| Zona Roja (Int) | 1-5 | 3-5 |
| Castigos | 7-56 | 4-26 |
| Pér | 1 | 2 |
| PERD | 0 | 0 |
| INT | 1 | 2 |
| TD Def. | 0 | 0 |
| Posesión | 30:06 | 29:54 |
2025 Posiciones
Conferencia Americana de Fútbol
| AFC Sur | G | P | E | PCT | PA | PC |
|---|---|---|---|---|---|---|
| Jacksonville | 13 | 4 | 0 | .765 | 474 | 336 |
| Houston | 12 | 5 | 0 | .706 | 404 | 295 |
| Indianapolis | 8 | 9 | 0 | .471 | 466 | 412 |
| Tennessee | 3 | 14 | 0 | .176 | 284 | 478 |
Conferencia Nacional de Fútbol
| NFC Sur | G | P | E | PCT | PA | PC |
|---|---|---|---|---|---|---|
| Carolina | 8 | 9 | 0 | .471 | 311 | 380 |
| Tampa Bay | 8 | 9 | 0 | .471 | 380 | 411 |
| Atlanta | 8 | 9 | 0 | .471 | 353 | 401 |
| New Orleans | 6 | 11 | 0 | .353 | 306 | 383 |
Noticias - NFL

¿Qué necesitan los Patriots para ganar?
La defensiva de Nueva Inglaterra debe provocar errores en Seattle.
2h

Super Bowl 2026: ¿Por qué ganarán los Seahawks?
Seattle fue el equipo más consistente en la temporada regular y superó sin problemas a sus rivales en playoffs.
3h

Super Bowl 2026: ¿Por qué ganarán los Patriots?
Ofensivamente, Maye debe funcionar rápido y en corto; defensivamente obligar a Seahawks a correr el balón
2h
GAMBLING PROBLEM? CALL 1-800-GAMBLER, (800) 327-5050 or visit gamblinghelplinema.org (MA). Call 877-8-HOPENY/text HOPENY (467369) (NY). Please Gamble Responsibly. 888-789-7777/visit ccpg.org (CT), or visit www.mdgamblinghelp.org (MD). 21+ and present in most states. (18+ DC/KY/NH/WY). Void in ONT/OR/NH. Eligibility restrictions apply. On behalf of Boot Hill Casino & Resort (KS). Terms: sportsbook.draftkings.com/promos.
Copyright: © 2026 ESPN Enterprises, Inc. All rights reserved.


