
New York Giants en Carolina Panthers

2-1, 1-0 Visitante
36
2-1, 1-0 Visitante

1-2, 1-1 Local
7
1-2, 1-1 Local
Líderes del Juego


288
E. ManningQB
27/35, 1 TD
288

242
C. NewtonQB
16/30, 3 INT
242

113
A. BrownRB
20 CAR, 2 TD
113
50
D. WilliamsRB
11 CAR
50

138
R. BardenWR
9 REC
138

98
G. OlsenTE
7 REC
98

1
O. UmenyioraDE
1

1
D. EdwardsDT
1

7
A. RolleS
7 SOLO
7

14
J. AndersonLB
7 SOLO
14
Estadísticas de Equipo


405
Yardas totales
327
0
Entregas
5
24
1eros Intentos
22
5-38
Penales
3-22
7/14
3ra oportunidad
4/9
0/0
4ta oportunidad
0/1
0/0
Zona Roja
0/0
36:10
Posesión
23:50
Información del partido
Charlotte, NC
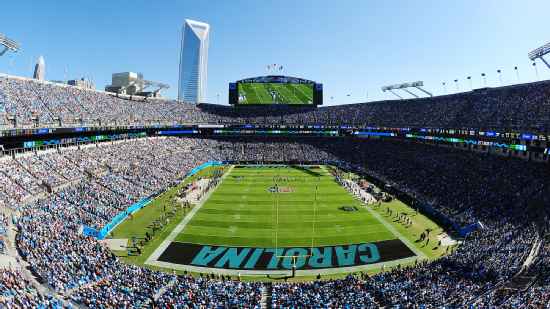
NFL Net
Estadísticas de Equipo
 | | |
|---|---|---|
| 1as. oportunidades | 24 | 22 |
| 1eros Intentos por pase | 15 | 14 |
| 1eros Intentos por Acarreo | 8 | 4 |
| 1eros Intentos por Penalizaciones | 1 | 4 |
| Eficiencia en 3er intento | 7-14 | 4-9 |
| Eficiencia en 4o intento | 0-0 | 0-1 |
| Jugadas Totales | 68 | 55 |
| Yardas Totales | 405 | 327 |
| Ofensivas totales | 10 | 9 |
| Yardas por jugada | 6.0 | 5.9 |
| Pasando | 280 | 267 |
| Intent-comp | 28/37 | 19/33 |
| Yardas por pase | 7.2 | 7.6 |
| INT | 0 | 3 |
| Capturas - Yardas perdidas | 2-12 | 2-21 |
| Yds | 125 | 60 |
| ACA | 29 | 20 |
| PROM | 4.3 | 3.0 |
| Zona Roja (Int) | 0-0 | 0-0 |
| Castigos | 5-38 | 3-22 |
| Pér | 0 | 5 |
| PERD | 0 | 2 |
| INT | 0 | 3 |
| TD Def. | 0 | 0 |
| Posesión | 36:10 | 23:50 |
2025 Posiciones
Conferencia Nacional de Fútbol
| NFC Este | G | P | E | PCT | PA | PC |
|---|---|---|---|---|---|---|
| Philadelphia | 11 | 6 | 0 | .647 | 379 | 325 |
| Dallas | 7 | 9 | 1 | .441 | 471 | 511 |
| Washington | 5 | 12 | 0 | .294 | 356 | 451 |
| New York | 4 | 13 | 0 | .235 | 381 | 439 |
| NFC Sur | G | P | E | PCT | PA | PC |
|---|---|---|---|---|---|---|
| Carolina | 8 | 9 | 0 | .471 | 311 | 380 |
| Tampa Bay | 8 | 9 | 0 | .471 | 380 | 411 |
| Atlanta | 8 | 9 | 0 | .471 | 353 | 401 |
| New Orleans | 6 | 11 | 0 | .353 | 306 | 383 |
Noticias - NFL

NFL: fechas de actividades y minicampamentos de los 32 equipos
La liga dio a conocer la fecha en la que volverán los equipos para el inicio de sus programas de entrenamiento de temporada baja.
15h
Rashee Rice, Chiefs, no enfrentará castigo por parte de la NFL
La liga concluyó su investigación sobre la conducta personal del receptor de Kansas City
18h

Jaguars extienden a Travon Walker por 4 años y $110 millones
Walker tenía previsto jugar bajo la opción de quinto año en 2026, la cual le habría reportado 15.196 millones de dólares totalmente garantizados
20h