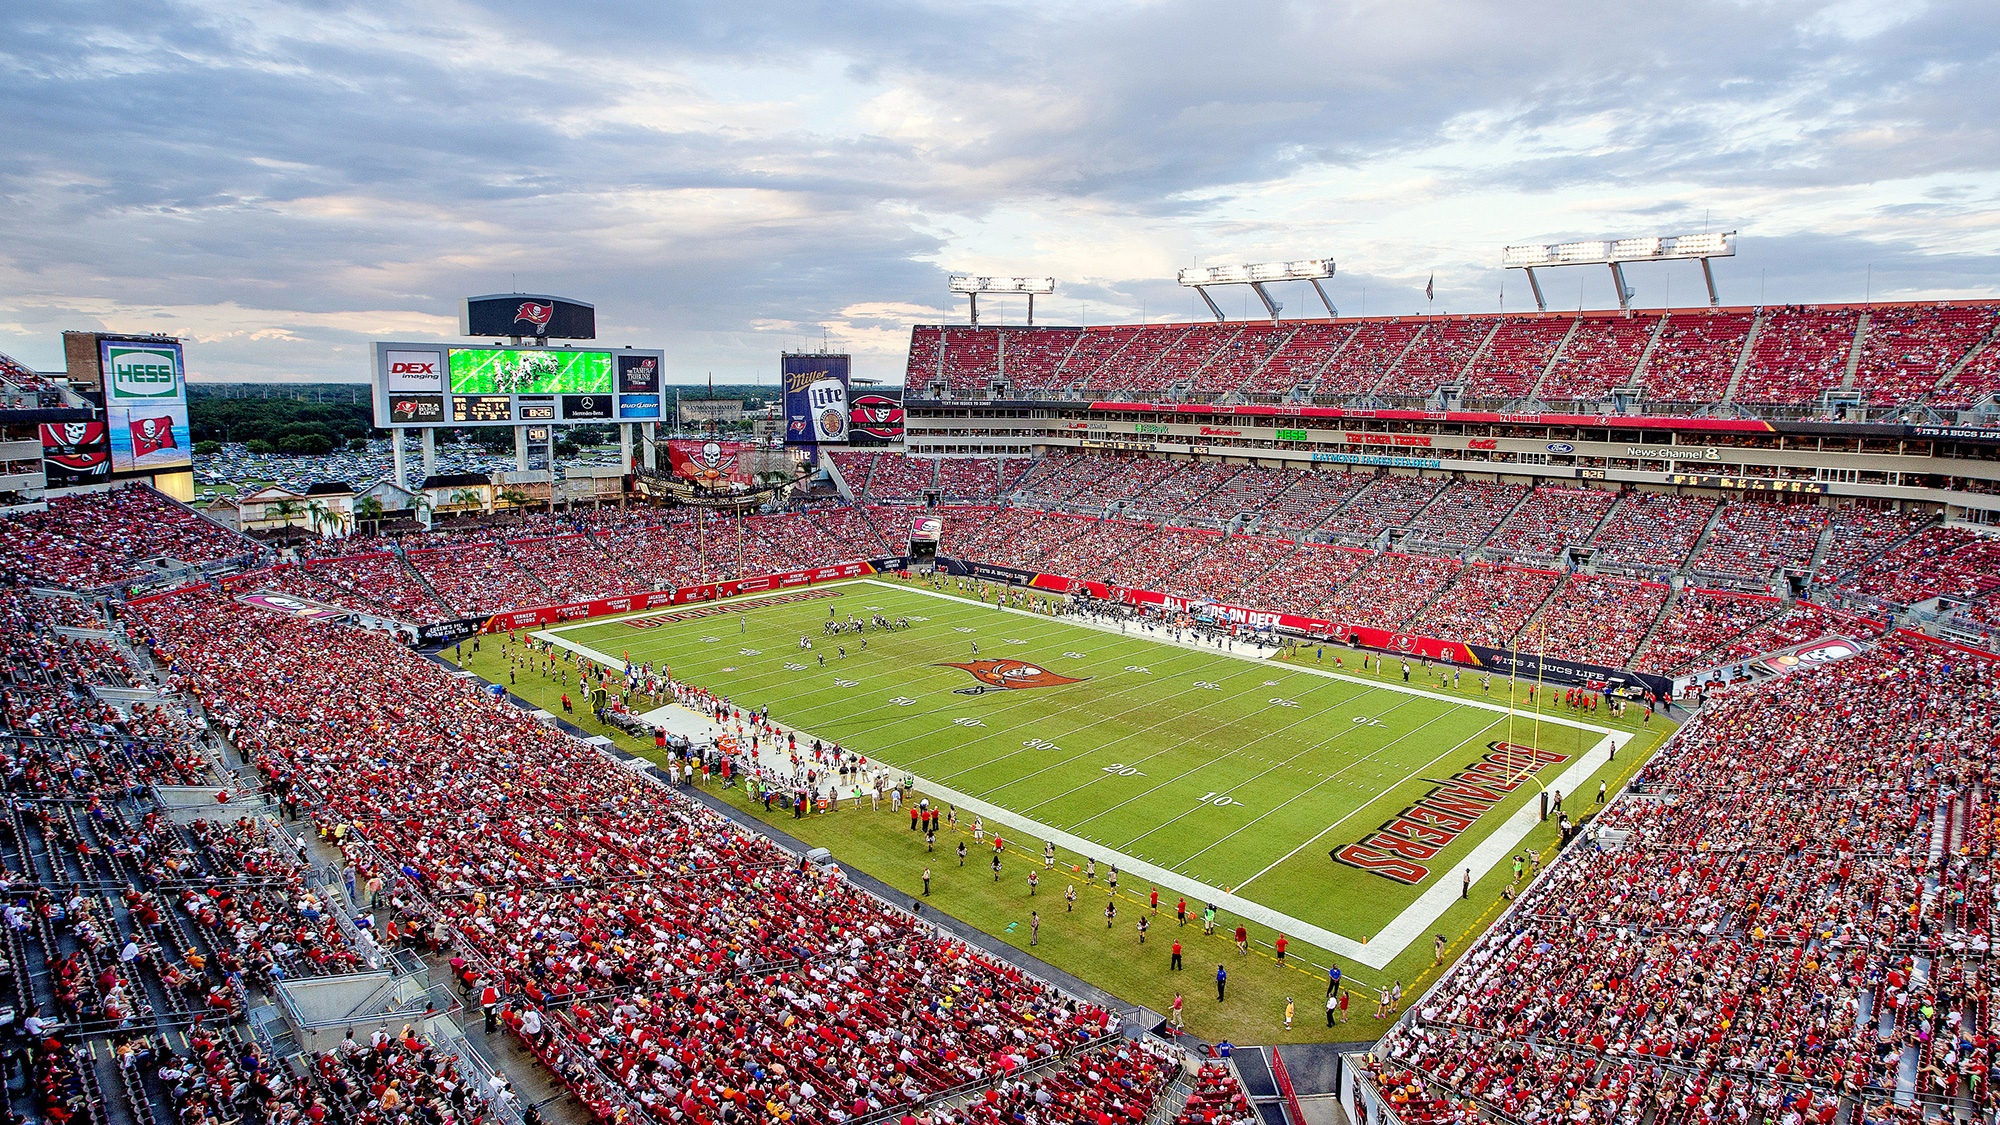
Indianapolis Colts en Tampa Bay Buccaneers
Líderes del Juego

251
J. BrissettQB
19/36, 2 TD
251

456
J. WinstonQB
33/45, 4 TD, 3 INT
456

38
M. MackRB
13 CAR, 1 TD
38

36
R. JonesRB
11 CAR
36

105
M. JohnsonWR
3 REC, 1 TD
105

91
C. Godwin Jr.WR
7 REC
91

1
J. HoustonLB
1

1
S. BarrettLB
1

11
K. WillisS
9 SOLO
11

9
J. WhiteheadS
6 SOLO
9
Estadísticas de Equipo
309
Yardas totales
542
1
Entregas
4
16
1eros Intentos
29
3-35
Penales
6-104
6/16
3ra oportunidad
8/15
2/3
4ta oportunidad
1/1
2/3
Zona Roja
4/4
25:45
Posesión
34:15
Información del partido
Tampa, FL

CBS

Estadísticas de Equipo
| 1as. oportunidades | 16 | 29 |
| 1eros Intentos por pase | 7 | 24 |
| 1eros Intentos por Acarreo | 6 | 5 |
| 1eros Intentos por Penalizaciones | 3 | 0 |
| Eficiencia en 3er intento | 6-16 | 8-15 |
| Eficiencia en 4o intento | 2-3 | 1-1 |
| Jugadas Totales | 59 | 78 |
| Yardas Totales | 309 | 542 |
| Ofensivas totales | 12 | 13 |
| Yardas por jugada | 5.2 | 6.9 |
| Pasando | 243 | 467 |
| Intent-comp | 19/36 | 35/49 |
| Yardas por pase | 6.6 | 9.3 |
| INT | 0 | 3 |
| Capturas - Yardas perdidas | 1-8 | 1-7 |
| Yds | 66 | 75 |
| ACA | 22 | 28 |
| PROM | 3.0 | 2.7 |
| Zona Roja (Int) | 2-3 | 4-4 |
| Castigos | 3-35 | 6-104 |
| Pér | 1 | 4 |
| PERD | 1 | 1 |
| INT | 0 | 3 |
| TD Def. | 2 | 0 |
| Posesión | 25:45 | 34:15 |
2025 Posiciones
Conferencia Americana de Fútbol
| AFC Sur | G | P | E | PCT | PA | PC |
|---|---|---|---|---|---|---|
| Jacksonville | 13 | 4 | 0 | .765 | 474 | 336 |
| Houston | 12 | 5 | 0 | .706 | 404 | 295 |
| Indianapolis | 8 | 9 | 0 | .471 | 466 | 412 |
| Tennessee | 3 | 14 | 0 | .176 | 284 | 478 |
Conferencia Nacional de Fútbol
| NFC Sur | G | P | E | PCT | PA | PC |
|---|---|---|---|---|---|---|
| Carolina | 8 | 9 | 0 | .471 | 311 | 380 |
| Tampa Bay | 8 | 9 | 0 | .471 | 380 | 411 |
| Atlanta | 8 | 9 | 0 | .471 | 353 | 401 |
| New Orleans | 6 | 11 | 0 | .353 | 306 | 383 |
Noticias - NFL

Qué viene para Christian González tras brillar en el Super Bowl con los Patriots
Pese a la derrota de su equipo fue elogiado por su labor defensiva.
2h

¡El próximo año, Disney va al Super Bowl!
El histórico evento de la NFL se podrá ver en vivo a través de ESPN y todas las plataformas de Disney.
3h

NFL Playoffs 2026: Seahawks campeones de Super Bowl 60
Seahawks vencieron a Patriots para ganar Super Bowl 60 el domingo 8 de febrero. Consulta todo de los NFL Playoffs 2026, resultados, análisis y más.
3h
GAMBLING PROBLEM? CALL 1-800-GAMBLER, (800) 327-5050 or visit gamblinghelplinema.org (MA). Call 877-8-HOPENY/text HOPENY (467369) (NY). Please Gamble Responsibly. 888-789-7777/visit ccpg.org (CT), or visit www.mdgamblinghelp.org (MD). 21+ and present in most states. (18+ DC/KY/NH/WY). Void in ONT/OR/NH. Eligibility restrictions apply. On behalf of Boot Hill Casino & Resort (KS). Terms: sportsbook.draftkings.com/promos.
Copyright: © 2026 ESPN Enterprises, Inc. All rights reserved.


